The new performance game
Hi there! I hope this year will be a year of learning, discovery and that we can achieve what we aim for!
What better subject to talk about then the problematic, that is often an afterthought, performance of our services or applications. Indeed when we are building an application we are focusing on the features we are delivering and how fast we can send it to production, with more quality and most of the time performance is not considered.
It doesn’t matter if you are using waterfall, some kind of agile or if you are already adopting DevOps, you must think of performance as a characteristic of your application that is embedded, intrinsic to your application. Years ago the end user was more forgiving regarding the performance of applications but nowadays it is not the case anymore, with fierce competition and impatient users, it is mandatory to have performant applications or we will fail.
In the old days performance was an extra effort that not all companies could afford, you needed performance engineers (those experts that come in with an specific knowledge), a production like environment (with all applications, services and data), that they can target with no risk of impacting production but that is close enough to extract proper conclusions.
In those times performance tests took a long time to put together and execute. They were executed after all the other tests were done, that means that they were the last to be executed far down the stream. As we know when we find performance issues fixing them is tricky, first because we do not always know what is the root cause of the performance issue (often we see a deterioration of a response time but we do not know exactly what is causing it), performance engineers not being part of the team makes this harder to find. Once the issue was identified it usually means that some architectural change must be done to correct such flaws, needing a meaningfull investment from the team in time and complexity (followed by the need to revalidate the other tests as we changed the core of the application).
Those were the reasons why we need to address performance earlier, addressing performance is not taking those heavy performance tests that we usually executed before production and executing those sooner. When we talk about pipelines what we need is faster release cycles, so it is inconceivable to have a long performance test running in a pipeline. We need to break these performance efforts into smaller validations, the teams need to think of the application performance as part of each feature, the knowledge and information of how the application are behaving in production must be easy to see and acted upon by the teams, the tools need to adapt and provide ways to execute performance earlier in the process, the teams needed to account for performance since day one and address performance challenges since conception.
When I was part of a test consultancy company the main clients we had in the beginning were clients with applications in production that were not performant enough to support the load they were having and so they wanted professionals that came in and assess the application status and suggest enhancements, of course after having the problematic application in production, this will only add extra burden on the team that needed to solve complex issues very fast…we know what that means.
The game have changed….
DevOps and Observability
DevOps and Observability will bring the performance concerns to the day to day of the teams, in this new reality the teams are concerned on how the application will behave in production and have data to check the impact of the changes they are delivering. With these new concerns the teams need ways to assure the performance of their application in each release of each application or service without impacting the overall times of delivery.
In fact the demand brought by the DevOps movement shifted the way performance was addressed, the tools and teams have answered with new ways to adapt performance tests in their pipelines. We no longer define long tests in the end only to validate performance but instead the concept now focuses on validating the performance of each application/service in each commit of code by comparing the actual performance with a baseline previously taken.
The tests are focused and fast, the teams create a baseline of indicators of what they believe the application must perform in good conditions, and use that baseline to compare to the results of each commit, understanding if the performance is worse, equal or better than previously.
Failure criteria are mandatory to validate such tests, no more relying in humans to interpret complex results and cross check all information to get a result, nowadays the teams with profound knowledge of their applications define failure criterion based on service layer indicators, such as response times or error percentages, and define thresholds of failure, if the error percentage exceeds 0.1% the test will fail, for example.
Tools have evolved and new tools have also emerged targeting this new way of testing, fully integrated in the pipelines, providing fast feedback to the teams about the performance status of their application in each commit, this as also improved the root cause analysis, because the teams now link a performance issue with a commit and focus in what have changed to find the culprit.
Another benefit of this new way of using performance tests is to be able to better anticipate performance issues, not letting the issues slide until it is too late to be act upon.
Performance tools
When we are searching for tools for such tasks we see that we have a lot available, for this example I will focus on the open source kind, that can be coded and integrated into a pipeline.
These tools must be easy to set up in any machine and be easy to execute in the developer computer for validating the tests. Once the tests are executing we need to have feedback available for the user and be able to check reports later, so producing reports is a must.
Jmeter, Gatling, k6 or Locust are the ones that we see appearing the most in the community as we can in the below image. Any of these tools will allow you to put your performance tests into code, exercise complex scenarios and get results back that can be interpreted by the pipeline, failing or succeeding, providing immediate feedback to the team.
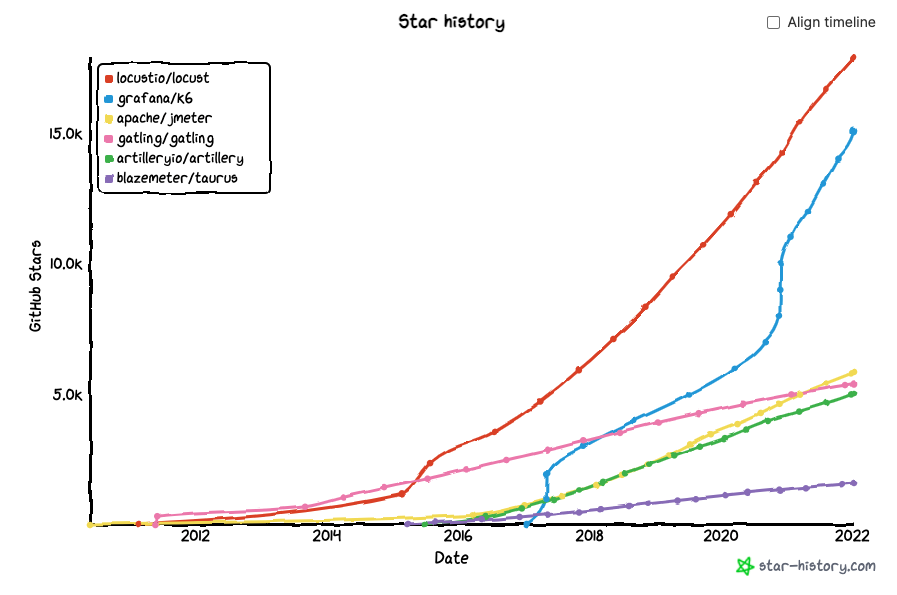 If you want to find out more or drill down on this information please check GitHub stars.
For those that have no interest in code whatsoever you can jump to the conclusion as the next two sections will go over a code example.
Gatling
Any of the above referenced tools could work perfectly for the example I want to let here regarding this new approach, but I choose Gatling, mostly because I like to learn new things and Gatling was originally written in scala (althoug you can use Java, Scala or Kotlin), but as I never used Scala and it is supposed to be (I never used scala before).
What is Scala?
Scala is a modern multi-paradigm programming language designed to express common programming patterns in a concise, elegant, and type-safe way. It seamlessly integrates features of object-oriented and functional languages.
Functional and object-oriented…looks good, let’s go!
One of the funny things of writing a blog is that you can experiment. If this was a real life situation I would choose the language already used in my team so that everyone can contribute to the project.
Gatling advertises itself with: “Gatling is designed for continuous load testing and integrates with your development pipeline. Gatling includes a web recorder and colorful reports.” that seems to match my needs.
Resuming my needs for defining performance tests in the pipeline:
- Ability to code the tests, define code that will be executed and return an actionable status.
- Easily define failure criteria, this will be used to define the result of the test.
- Use different virtual users in different scenarios, this will allow me to load my application with different virtual users and define test scenarios to exercise the application.
If you have doubts regarding the installation of the tool please check the documentation that is available here.
Let’s jump into the example where we will see how Gatling answer to those needs in more detail.
Lab
I will use the BlazeMeter Demo site as the target of my tests (a demo site built by Blazemeter exactly to exercise tests). This site will allow me to reserve and book flights with different origins/destinations, so this is what I want to exercise.
I want to make sure that when we have a normal flow of users using this endpoint everything runs without any unexpected error. You may ask why did I choose this endpoints to exercise and not others, you and your team are responsible to understand your application and see what are the most critical flows that you must assure that cannot fail when pushed or that may hide some bottlenecks, it is all about criticality or impact to the end user.
For this example, and after consulting my team :), we have decided that the critical flows we want to exercise are in fact the “/reserve.php” and the “/purchase.php” endpoints.
Using Gatling I have defined a main class that will extend Simulation, here I defined two different objects that will hold the steps needed to perform each operation as we can below:
object Reserve {
    val reserve = exec(http("Access Reserve").post("/reserve.php")
    .formParam("""fromPort""", """Paris""")
    .formParam("""toPort""","""Buenos+Aires"""))
    .pause(2, 3)
}

object Purchase {
    val purchase = exec(http("Access Purchase").post("/purchase.php")
    .formParam("""fromPort""", """Paris""")
    .formParam("""toPort""", """Buenos+Aires""")
    .formParam("""airline""", """Virgin+America""")
    .formParam("""flight""", """43""")
    .formParam("""price""", """472.56"""))
    .pause(2, 3)
}
You can see above that Scala is almost human readable, in fact I’m executing an access through HTTP via Post request to the relative endpoint passing the parameters defined there and finally pausing the operation (for 2 or 3 seconds) to simulate a real user. These will be the actions I want to perform.
Next I want to configure the protocol to be used, this is done in another object that I have called httpProtocol, as we can see below.
val httpProtocol = http
    .baseUrl("http://blazedemo.com")
    .acceptHeader("text/html,application/xhtml+xml,application/xml;q=0.9,*/*;q=0.8")
    .doNotTrackHeader("1")
    .acceptLanguageHeader("en-US,en;q=0.5")
    .acceptEncodingHeader("gzip, deflate")
    .userAgentHeader("Mozilla/5.0 (Macintosh; Intel Mac OS X 10.8; rv:16.0) Gecko/20100101 Firefox/16.0")
All parameters regarding the http connection are defined here and we can also see the baseUrl being defined, this is what allows me to use the relative enpoint in the above objects that represent my operations: Purchase and Reserve.
Next I can define my scenarios, this is usually where we define the more complex scenarios by combining different operation objects. In my case they are quite simple:
val reserveUsers = scenario("ReserveUsers").exec(Reserve.reserve)
val purchaseUsers = scenario("PurchaseUsers").exec(Purchase.purchase)
But if I needed to purchase after the reservation operation it would like this:
val purchaseUsers = scenario("PurchaseUsers").exec(Reserve.reserve).exec(Purchase.purchase)
Notice that I have named those scenarios to help me setting up the performance scenario later on.
For this Gatling as a special method called setUp, here we define which operations we are going to perform, with how many virtual users (defining how we want to ramp those users up or down) and for how much time.
Let’s say that I want to inject twenty users at once performing the reserveUsers scenario and that I want alsoinject 20 users but this time not at once but ramping those up for 5 minutes (meaning that instead of pushing 20 users at once Gatling will pace the creation of those users in the 5 minute interval). Of course all of this using the httpProtocol definition we just defined above:
setUp(
    reserveUsers.inject(atOnceUsers(20)),
    purchaseUsers.inject(rampUsers(20).during(5.minutes))
).protocols(httpProtocol)
Confess it, it’s really easy to read, right?
This is enough to execute the performance tests but remember that we want to define a failure criteria, for this Galting has an assertions method that will allow you to define multiple failure criterias.
In my case, and after double checking with my team :), we want the test to be considered a success in the following conditions:
- if the 90 percentile of the global response time is lesser than 5000 milliseconds
- if the global failed requests are less then or equal to 0
- if the global requests per second are lesser than 500
Gatling allows this definition in the setUp object by chaining the assertions method like below:
setUp(
    reserveUsers.inject(atOnceUsers(20)),
    purchaseUsers.inject(rampUsers(20).during(5.minutes))
).assertions(
    global.responseTime.percentile(90).lt(5000),
    global.failedRequests.count.lte(0),
    global.requestsPerSec.lt(500)
).protocols(httpProtocol)
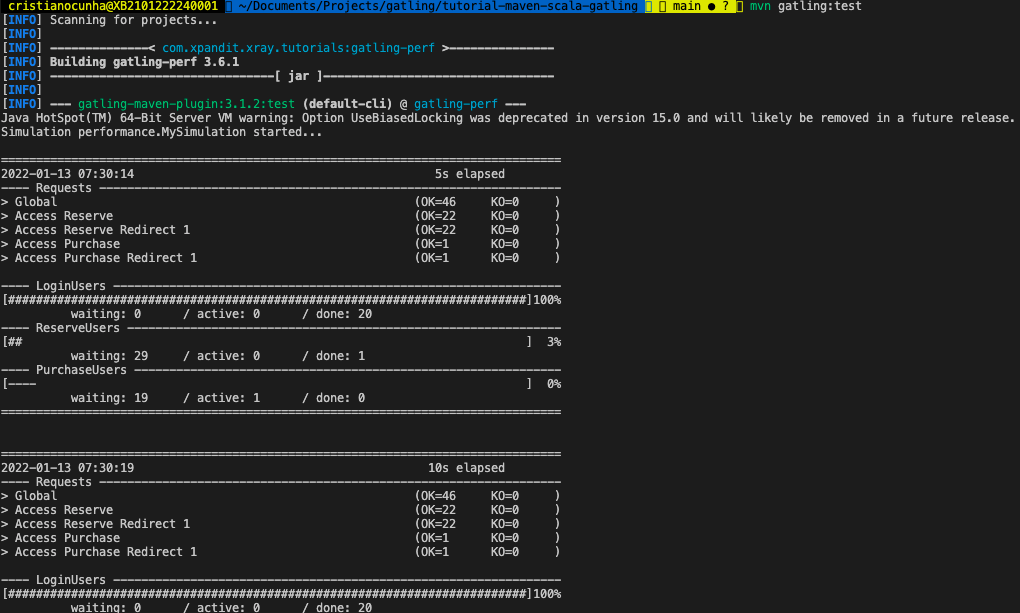
At last we need to execute the test and check its behaviour, for that I’m using the Maven plugin so that I can execute tests using the following line:
mvn gatling:test
We can follow the progress of the test in the terminal as we can see here:
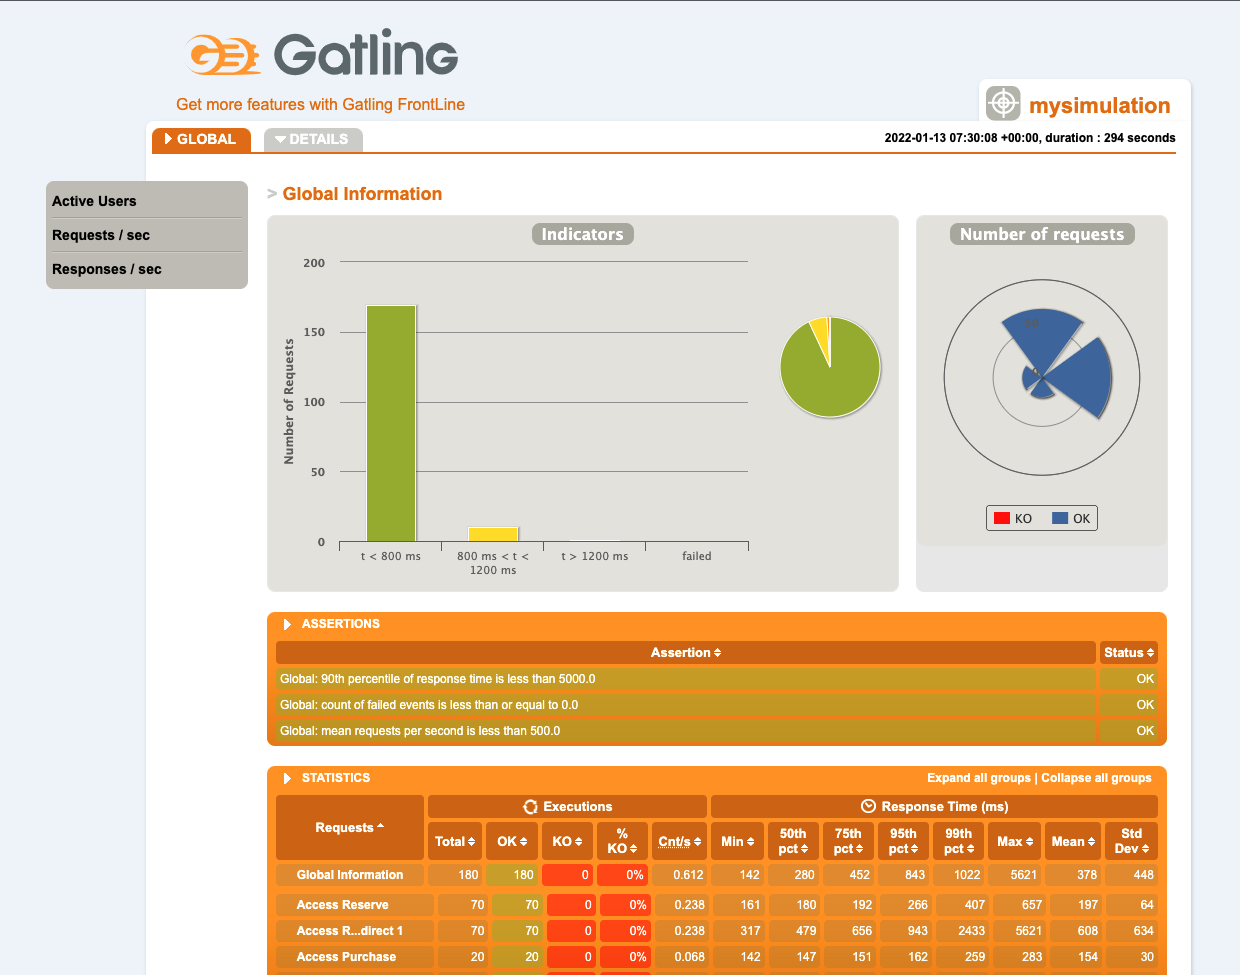
Once the execution finishes we can check the status in the terminal as well where we can find some indicators in the Global Information area and the path of the report generated.
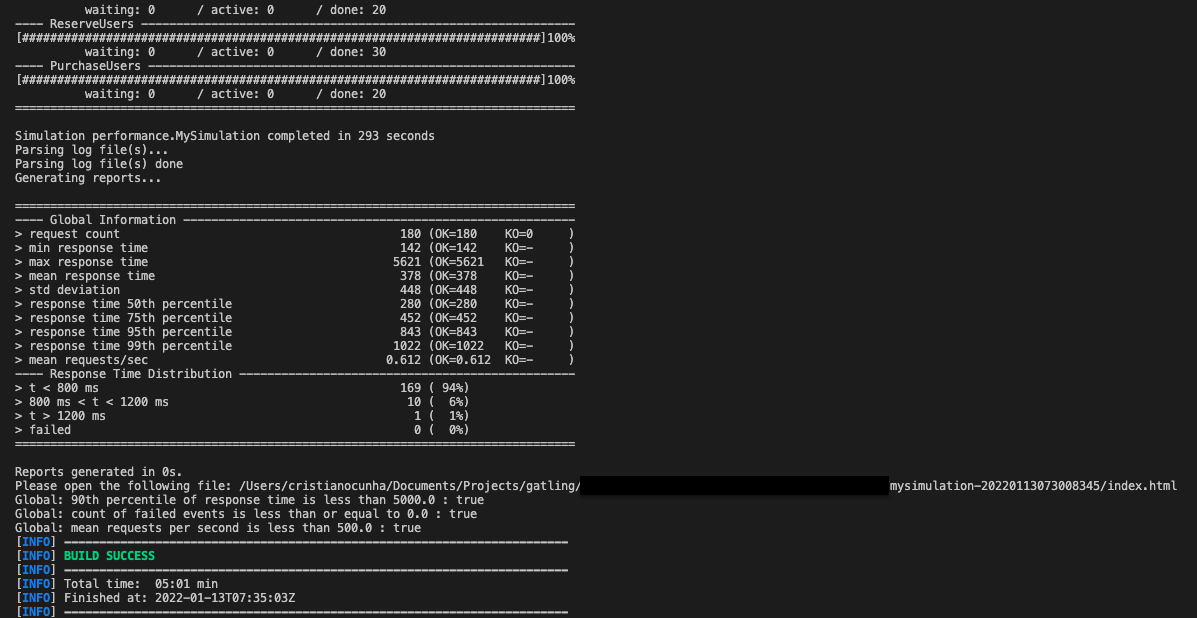
Gatling also produces an Html report in the above path, in my case its: ./target/gatling/mysimulation-date, this report is really nice as it has the details of the execution and a step by step view of the data.
In this report you have a global and detailed view of the data that allow you to perform different types of analysis. In the global view you have direct access to the status of the test and of overall indicators for requests made.
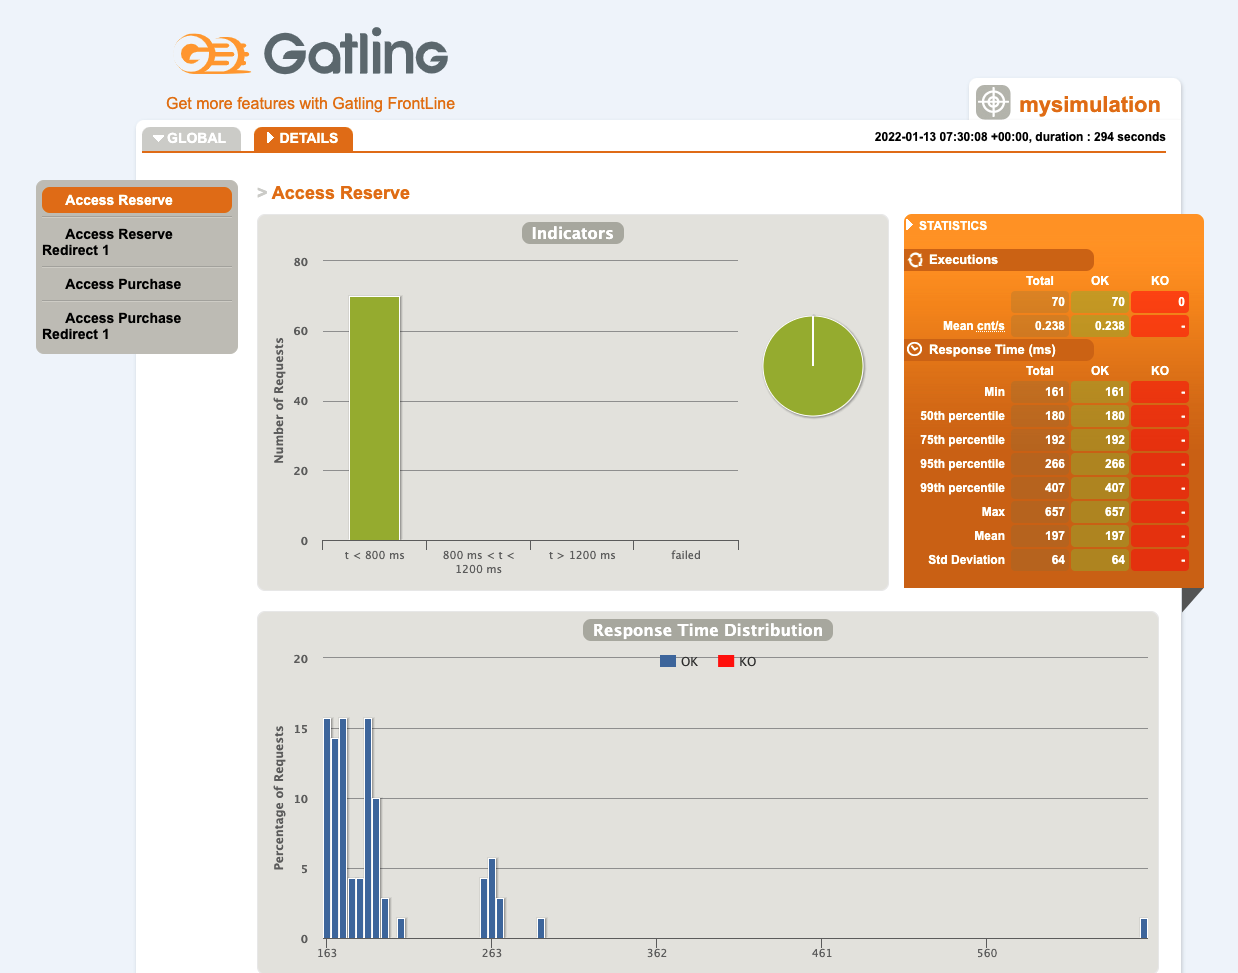
If you need to drill down you can access the detailed report that will show you detailed information of each operation.
The only thing that I think we could do better is to follow the test while running instead of looking at a report in the end only, of course we can follow the terminal output but it is not friendly at all.
The next section will be targeting exactly that: How can we follow the test execution with a nice customizable dashboard.
Influxdb & Graphana
Most of these tools can send the data that they are gathering to different destinations, the default one is to file but we can use another destination such a database. But not any database, a time series database that was built exactly to receive time series data from performance requests. In this space I have choosen InfluxDB.
Having data available in a database is good but I need a way to view it in real time, what better tool than Graphana and its dashboards? If you are connected to the DevOps or Observability world Graphana is no stranger, it is the de facto open source dashboard tool, and it can use an InfluxDB as its source and build dashboards that will be custom to your needs.
More than focusing on the tools, because there are others out there that are capable to do the same job, I just wanted to reiterate the importance of understanding what is happening when your performance test is running. These tools will allow you to look at the data produced by the performance test in a more user-friendly way.
The performance frameworks usually produce data in logs with details of what is happening but those logs are sometimes hard to interpret with our bare eyes, they are supposed to be processed so that we can extract valuable conclusions.
This solution will enable you to ship those logs to an InfluxDB database and use Graphana to show that data in readable dashboards.
It is in fact a nice to have, but if it is so easy to set up why not?
I will not along this post with how to configure these dashboards as BlazeMeter already did in one of their blog post that I have used to complement this solution, so please check this URL and follow it if you want to ship your logs to InfluxDB and see your data in a fully customizable dashboard in Graphana.
Note: Yes they are docker images but everything is Docker nowadays so do not be afraid to try it out as the example is really straight forward.
Let me just show what it look like:
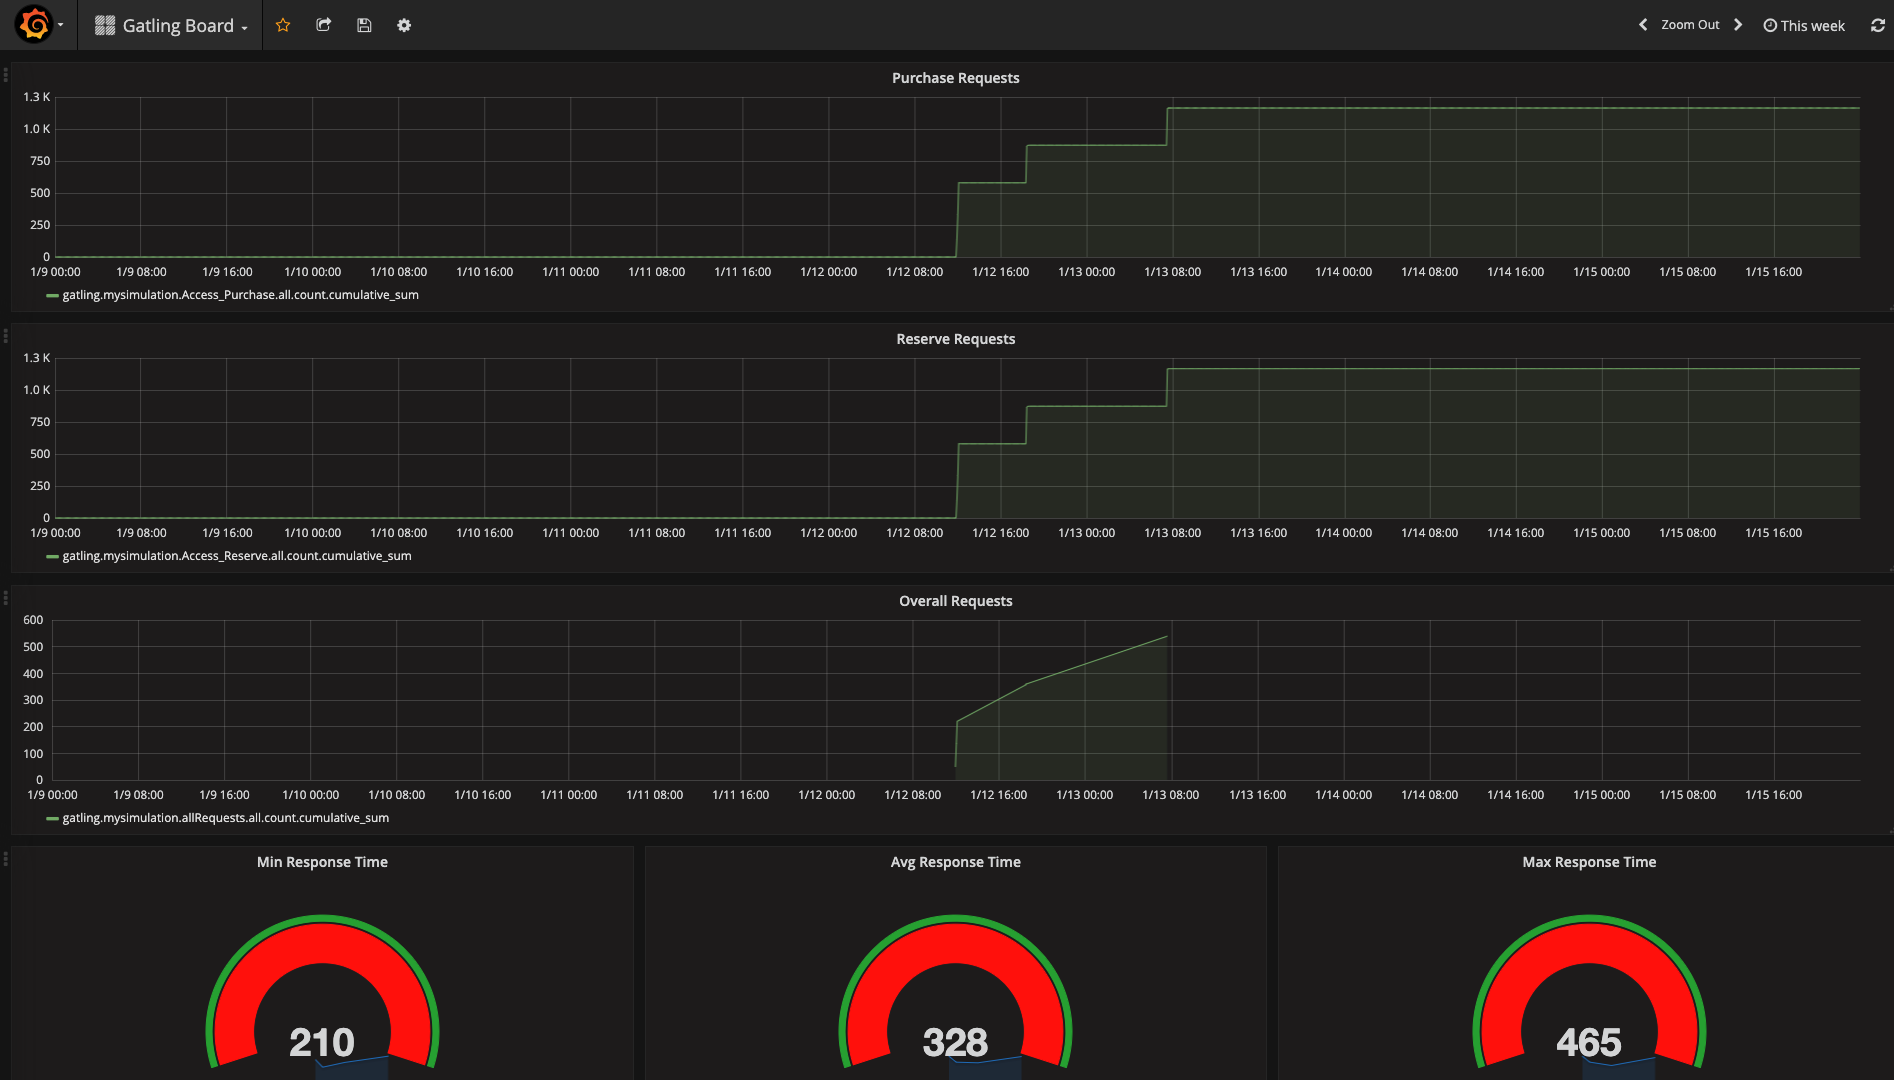
When the tests are running accessing this dashboard will provide you a real sense of what is going because it is updated during the test execution.
Conclusion
As you can see these tools can be a valuable asset for you to assess earlier in the process the performance of your applications, it will push the team to understand how the application will behave and how it was supposed to behave in order to write the performance tests.
It will also increase the confidence of the team that the application is performant enough to cope with the demands of the users in production, bringing peace of mind for the team.
It also approaches the team to performance concepts/engineers as they will start to talk the same language. From those synergies they can create even better performance validations complementing each other.
Your application will be more stable regarding its performance, with these methods you can reduce the variations in each build and deliver a healthier build to those heavy performance tests that are still needed but that will be executed with higher quality builds and focused on performance aspects not addressed by the performance tests added in the beginning of the process.
Are you ready (and excited) to play this new performance game?
Have a great 2022! See you in my next article ;)
Check the podcast regarding this article in the Test Guild Performance or the video.